Tag: intraday trading

  • 11 Powerful Candlestick Patterns Every Indian Trader Should Know in 2026 (With Practical Examples)

    candlestick patterns India 2026 are the foundation of technical analysis and one of the most powerful tools any trader can master. Whether you are trading Bank Nifty options, Nifty 50 futures, or individual stocks, understanding these patterns gives you a significant edge in reading market sentiment and timing your entries and exits. In this comprehensive guide, we will explore 11 powerful candlestick patterns that every Indian trader should know in 2026, complete with practical examples that you can apply to your trading right away.
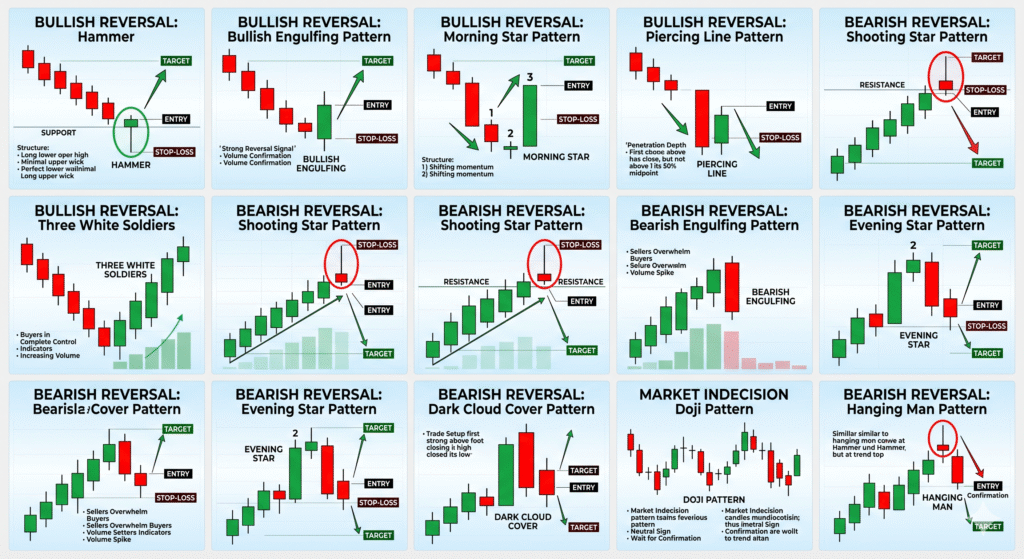
    What is a Candlestick Chart?

    A candlestick chart is a type of financial chart used to describe price movements of a security, derivative, or currency. Each candlestick represents a specific time period and shows four key pieces of information: the opening price, closing price, high price, and low price. A green or white candle indicates a bullish period where the closing price is higher than the opening price. A red or black candle indicates a bearish period where the closing price is lower than the opening price. The thin lines extending from the top and bottom are called wicks or shadows, representing the price extremes during that period.

    Why Candlestick Patterns Matter

    Candlestick patterns reveal the psychology of market participants. Each pattern tells a story about the battle between buyers (bulls) and sellers (bears). When you learn to read these patterns, you are essentially reading market sentiment before it plays out. This gives you a significant advantage over traders who rely solely on lagging indicators. The patterns we discuss below are among the most reliable and widely used by professional traders across the world.

    BULLISH REVERSAL PATTERNS

    Hammer

    Structure: A single candle with a small body at the top and a long lower wick (at least twice the size of the body). The upper wick is minimal or non-existent.

    What It Signals: The Hammer appears after a downtrend and signals a potential bullish reversal. It shows that sellers pushed prices down significantly during the session, but buyers stepped in strongly and drove the price back up near the opening level, indicating buying pressure is increasing.

    How to Trade It: Look for the Hammer pattern near a key support level after a clear downtrend.

    Entry: Place a buy order above the high of the Hammer candle.

    Stop-Loss: Place the stop-loss just below the low of the Hammer candle.

    Target: Aim for the next resistance level.

    Example: If Tata Motors is in a downtrend and forms a Hammer at Rs. 900, with a low of Rs. 880 and a high of Rs. 910, you can enter above Rs. 910, set a stop-loss below Rs. 880, and target the next resistance at Rs. 950.

    Bullish Engulfing Pattern

    Structure: A two-candle pattern where a large green (bullish) candle completely engulfs the body of the preceding small red (bearish) candle. The pattern forms at the bottom of a downtrend.

    What It Signals: The Bullish Engulfing is one of the strongest reversal signals. It indicates that buyers have aggressively stepped in and overwhelmed the selling pressure, suggesting a potential trend reversal from bearish to bullish.

    How to Trade It: Look for this pattern near support levels or after a sustained downtrend on Bank Nifty, Nifty 50, or individual stocks.

    Confirmation: Always look for high volume on the green engulfing candle for added reliability.

    Entry: Buy above the high of the engulfing candle.

    Stop-Loss: Place below the low of the red candle.

    Morning Star Pattern

    Structure: A three-candle pattern consisting of a long bearish candle, followed by a small-bodied candle (either bullish or bearish), and ending with a long bullish candle.

    What It Signals: The Morning Star signals a strong bullish reversal. It shows that sellers are losing control, buyers are stepping in, and the momentum is shifting upward. The longer the third bullish candle, the more reliable the reversal signal.

    How to Trade It: This pattern is highly reliable when it appears after a sustained downtrend. Look for volume confirmation on the third candle.

    Entry: Buy above the high of the third candle.

    Stop-Loss: Below the low of the Morning Star formation.

    Target: Next major resistance level or previous swing high.

    Example: When Reliance Industries fell from Rs. 2,800 and formed a Morning Star at Rs. 2,400, buyers could enter at Rs. 2,420 with a stop-loss at Rs. 2,380 and target Rs. 2,600.

    Piercing Line Pattern

    Structure: A two-candle pattern where a strong bearish candle is followed by a bullish candle that opens below the previous candle’s close but closes above the midpoint (50%) of the first bearish candle.

    What It Signals: The Piercing Line indicates a bullish reversal signal, showing that buyers are stepping in and reversing the downtrend. The more the second candle penetrates into the first candle, the stronger the reversal signal.

    How to Trade It: Look for this pattern at support zones on daily or 15-minute charts for intraday trades.

    Entry: Buy above the high of the piercing candle.

    Stop-Loss: Below the low of the Piercing Line formation.

    Three White Soldiers

    Structure: Three consecutive long bullish candles, each opening within the body of the previous candle and closing at a new high. All three candles should have minimal upper wicks.

    What It Signals: Three White Soldiers is a very strong bullish reversal pattern. It shows that buyers are in complete control and are pushing prices higher with conviction across multiple sessions.

    How to Trade It: This pattern is most reliable after a prolonged downtrend. Look for increasing volume across all three candles for added confirmation.

    Entry: Enter after the third candle closes, on the next candle’s open.

    Stop-Loss: Below the low of the first soldier candle.

    BEARISH REVERSAL PATTERNS

    Shooting Star Pattern

    Structure: A single candlestick with a small body at the bottom and a long upper wick. The lower wick is minimal or non-existent. The Shooting Star is the bearish opposite of the Hammer.

    What It Signals: The Shooting Star appears after an uptrend and signals a potential bearish reversal. It shows that buyers pushed the price higher during the session, but sellers aggressively rejected the highs and pushed the price back down, indicating selling pressure is building.

    How to Trade It: Look for this pattern near resistance levels after a clear uptrend on Bank Nifty or Nifty options.

    Entry: Place a sell (short) order below the low of the Shooting Star candle.

    Stop-Loss: Above the high of the Shooting Star candle.

    Target: The next support level below.

    Example: If Bank Nifty is trending up and forms a Shooting Star at 52,000 with a high of 52,200 and low of 51,800, traders can short below 51,800 with a stop-loss above 52,200, targeting 51,400.

    Bearish Engulfing Pattern

    Structure: A two-candle pattern where a large red (bearish) candle completely engulfs the body of the preceding small green (bullish) candle. This is the bearish counterpart of the Bullish Engulfing.

    What It Signals: The Bearish Engulfing implies that sellers have overwhelmed the buyers, suggesting a shift in market sentiment from bullish to bearish. It is one of the strongest bearish reversal signals.

    How to Trade It: Look for this pattern near resistance zones. Always confirm with high volume on the red engulfing candle.

    Entry: Sell below the low of the engulfing candle.

    Stop-Loss: Above the high of the engulfing candle.

    Evening Star Pattern

    Structure: A three-candle pattern consisting of a long bullish candle, followed by a small-bodied candle, and then a long bearish candle. It is the bearish opposite of the Morning Star.

    What It Signals: The Evening Star indicates the reversal of an uptrend. The pattern is particularly strong when the third candle completely erases the gains of the first candle, showing that sellers have taken full control.

    How to Trade It: Highly reliable when it appears after a strong uptrend. Watch for volume spike on the third candle.

    Entry: Sell below the low of the third candle.

    Stop-Loss: Above the high of the Evening Star formation.

    Dark Cloud Cover Pattern

    Structure: A two-candle pattern where a long green candle is followed by a long red candle that opens above the previous green candle’s high and closes below its low.

    What It Signals: This pattern signals a potential reversal of the uptrend. It shows that despite the bullish momentum on the first day, sellers took complete control on the second day, pushing the price below the previous low.

    How to Trade It: Look for this pattern at resistance zones on daily charts for swing trades, or on 15-minute charts for intraday setups.

    Entry: Sell below the low of the Dark Cloud Cover formation.

    Stop-Loss: Above the high of the red candle.

    Doji Pattern (Market Indecision)

    Structure: A Doji forms when the opening and closing prices are almost identical, creating a candle with no body or a very small body and equal upper and lower shadows. It looks like a cross or plus sign.

    What It Signals: The Doji signifies indecision in the market. Neither bulls nor bears are in control, and a potential reversal or significant price move could be imminent. A Doji appearing after a strong trend often signals trend exhaustion.

    How to Trade It: Never trade a Doji in isolation. Always wait for confirmation from the next candle.

    If the next candle is bullish, consider a long entry. If bearish, consider a short entry.

    Hanging Man Pattern

    Structure: A single candlestick with a small body at the top and a long lower wick, similar to the Hammer but appearing at the top of an uptrend instead of the bottom of a downtrend.

    What It Signals: The Hanging Man indicates that buyers are losing control and sellers may be taking charge. Although the price was pushed up during the session, sellers managed to drive it down significantly, warning of a possible bearish reversal.

    How to Trade It: Look for this pattern near resistance levels after a sustained uptrend. Wait for bearish confirmation from the next candle before entering a short position.

    Entry: Sell below the low of the Hanging Man candle after bearish confirmation.

    Stop-Loss: Above the high of the Hanging Man candle.

    Key Tips for Trading Candlestick Patterns Successfully

    Here are essential tips every Indian trader should follow when using candlestick patterns:

    Always trade patterns at key support or resistance levels for higher probability setups.

    Confirm patterns with volume. High volume during the pattern formation increases reliability.

    Combine candlestick patterns with other technical tools like moving averages, RSI, or MACD for confluence.

    Always use a stop-loss. No pattern is 100% reliable.

    Practice pattern recognition on historical charts before risking real money.

    Patterns work across all timeframes, but daily and 15-minute charts are most popular among Indian traders for swing and intraday trading respectively.

    Conclusion

    Mastering candlestick patterns is a game-changer for any trader looking to succeed in the Indian stock market. These 11 powerful candlestick patterns provide a visual representation of market psychology and can significantly improve your entry and exit timing. Whether you trade Bank Nifty options, Nifty 50 futures, or individual stocks on NSE and BSE, these patterns will serve as your roadmap to understanding price action.

    Remember, no single pattern guarantees success. The key is to combine these patterns with proper risk management, sound trading psychology, and confirmation from other technical tools. Start by mastering 3-4 patterns, practice them consistently on paper trades or with small positions, and gradually expand your knowledge. With dedication and practice, candlestick patterns will become an invaluable part of your trading toolkit.
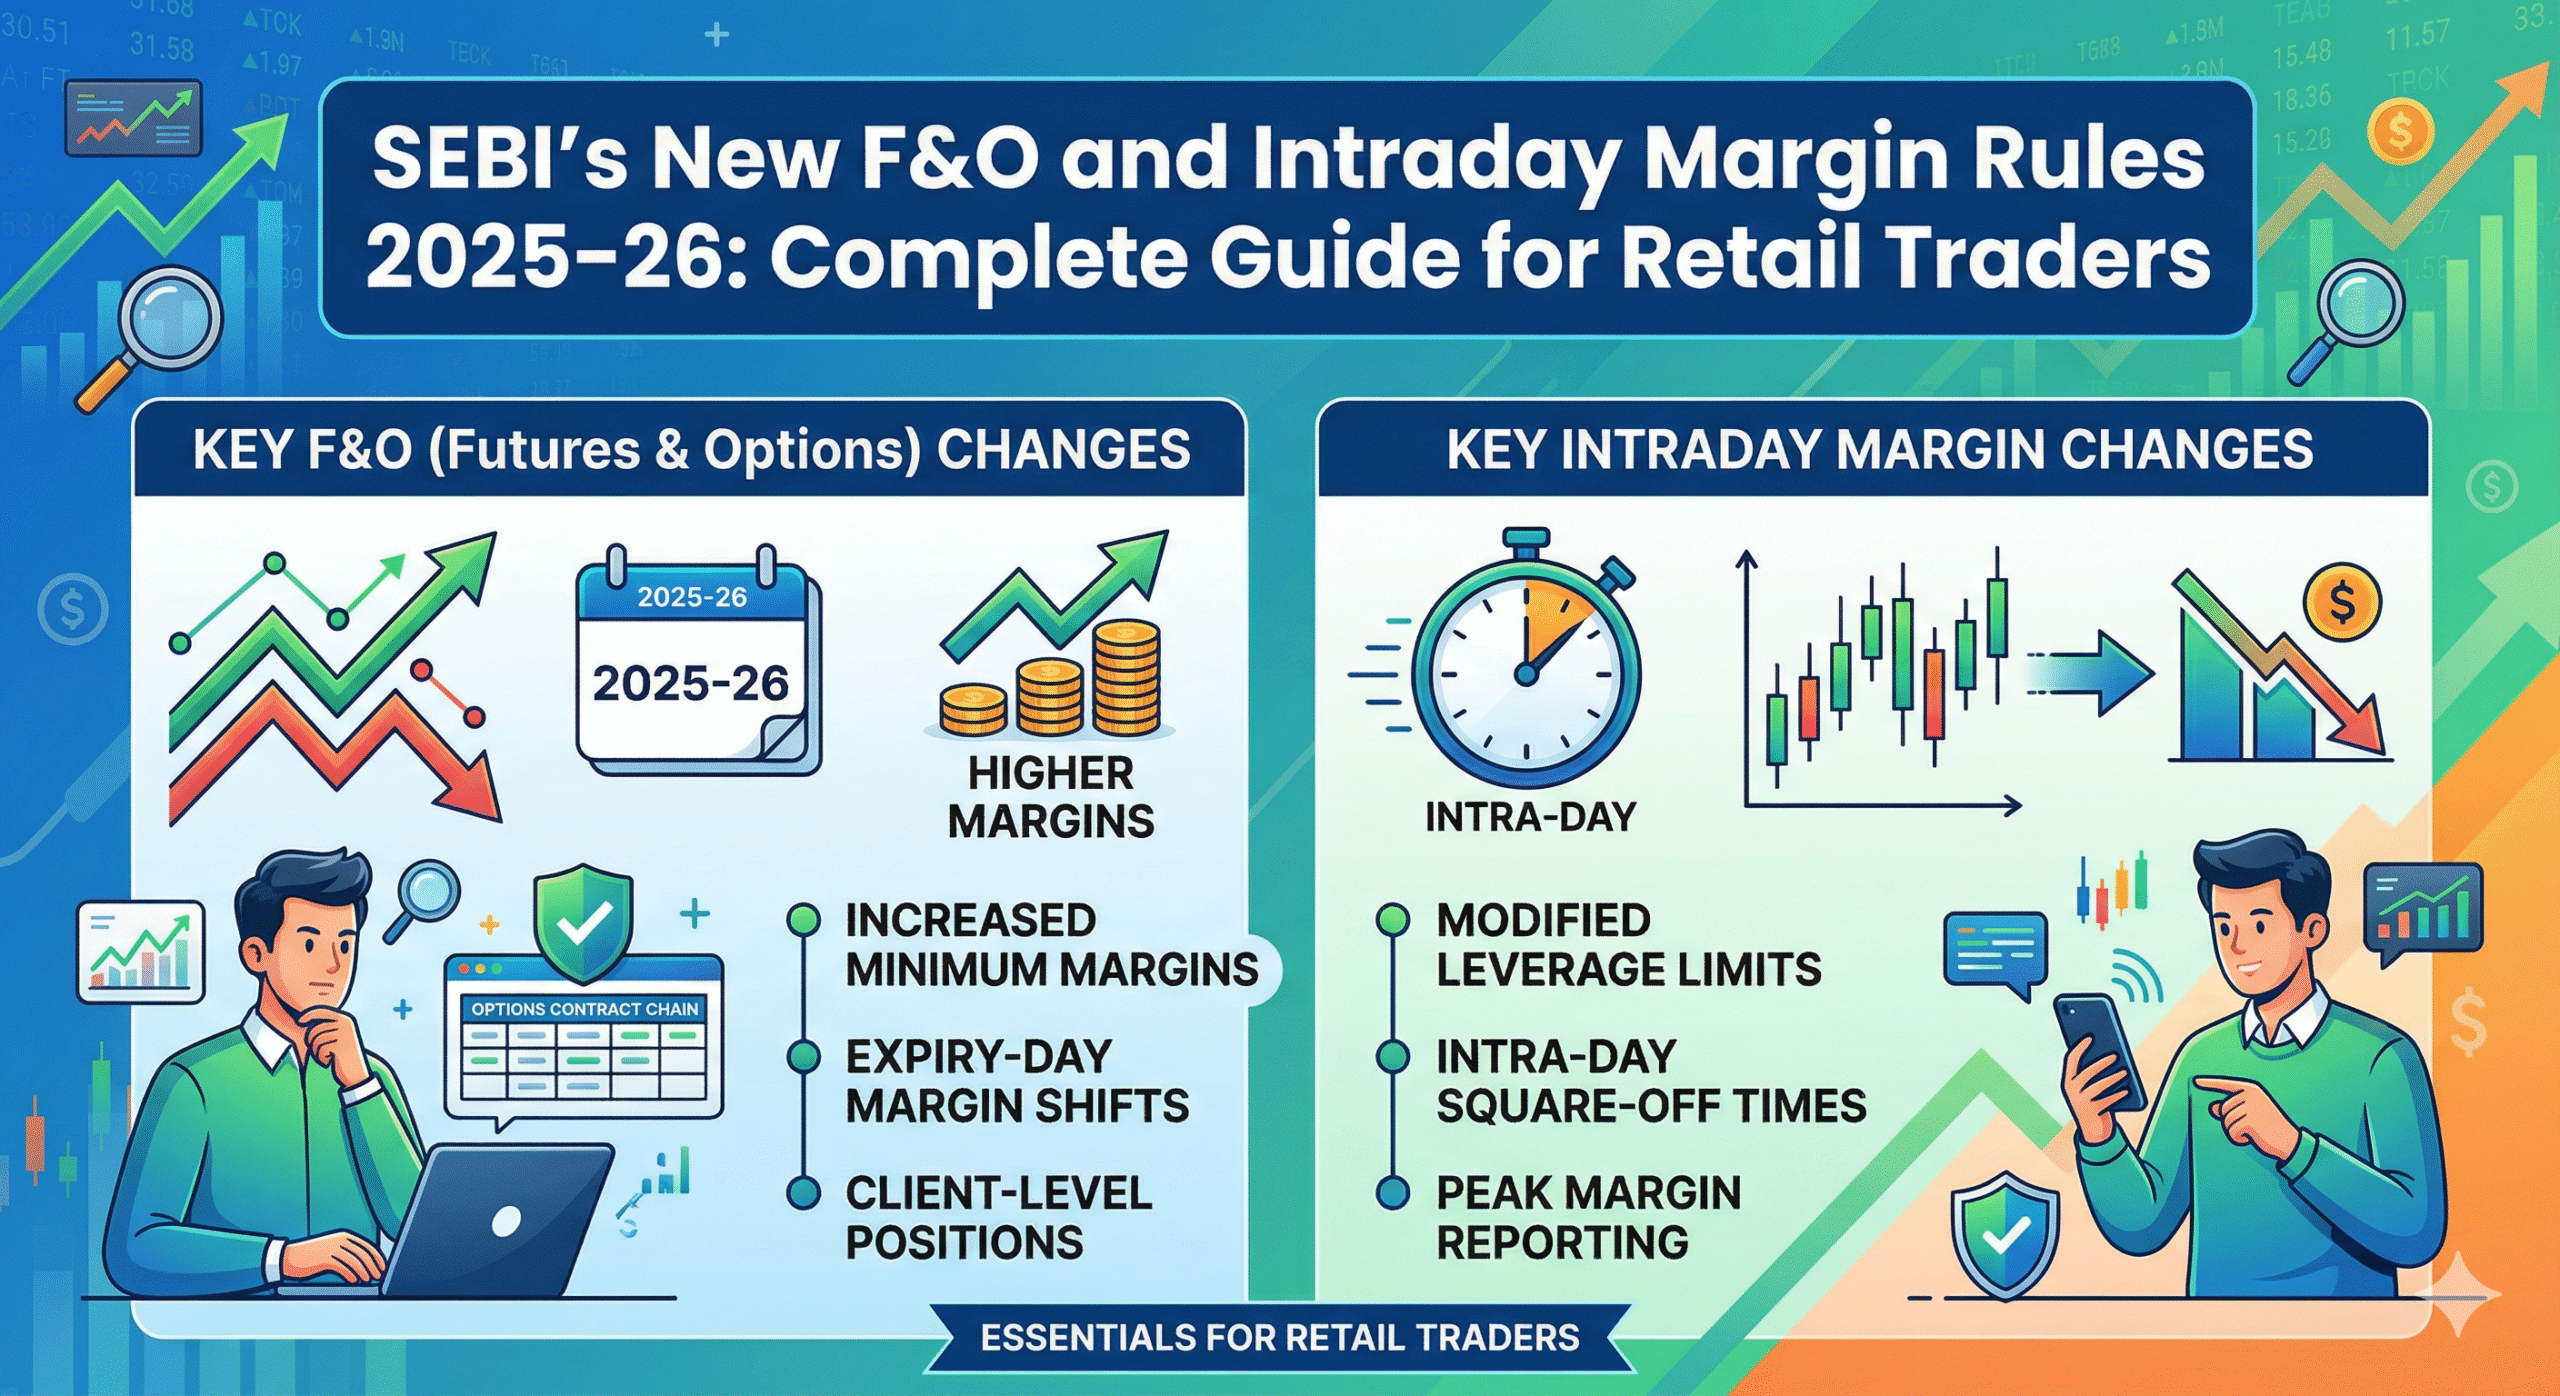

  • SEBI’s New F&O and Intraday Margin Rules 2025–26: Complete Guide for Retail Traders

    SEBI’s New F&O and Intraday Margin Rules 2025–26: Complete Guide for Retail Traders

    If you trade intraday or in F&O, SEBI’s new rules in 2025–26 are silently changing your P&L whether you realise it or not. The era of extreme high leverage, ultra‑low margin and aggressive expiry‑day gambling is ending, and every retail trader needs to understand this shift clearly.

    In this article, we will break down the new rules in simple language with practical trading examples, and then see how you should adjust your intraday and F&O trading style accordingly.

    Why Did SEBI Change the Rules? – Background for Retail Traders

    Over the last few years, SEBI’s data has shown that around 89–93% of individual F&O traders were losing money, and losing it very fast. Most of the damage was due to very high leverage, lack of proper risk management, and a “quick money” mindset.

    The regulator had two main objectives:

    • Protect retail traders from uncontrolled leverage
    • Make the F&O market more stable and risk‑controlled

    That is why margins, leverage, weekly expiry structure and lot sizes have all been tightened over time.

    Intraday Margin Rules 2025–26 – How Much Margin and Leverage Now?

    For intraday traders, the biggest visible change is in margin rules.

    1. 20% Minimum Upfront Margin – Explained

    In the equity cash segment, you now need to pay a minimum of 20% upfront margin to take an intraday trade.

    • Example: If you want to take an intraday buy trade worth 1,00,000, you must keep at least 20,000 as margin with your broker.
    • This is calculated using the VaR + ELM framework, and brokers must collect this margin latest by T+1.

    In simple terms, the old style of “30–40X leverage in random small‑cap stocks with tiny capital” is practically over.

    2. Why You Don’t Get More Than Around 5X Leverage Now

    Under SEBI’s new margin framework, brokers can give only limited intraday leverage, usually up to about 5X.

    • Earlier, some brokers used to offer 20X–40X intraday leverage, allowing huge positions with very small capital.
    • Now, if a broker goes beyond the framework, they face penalties and compliance issues.

    Result: either you increase your trading capital or you reduce your position size to match the new reality.

    New F&O Rules 2025 – What Changed for Option Buyers and Sellers?

    SEBI has also brought strong changes in the F&O segment from 2025 onwards.

    1. Full Premium Upfront – No Extra Leverage for Option Buyers

    Option buyers now have to pay the full premium upfront – there is effectively no extra leverage for buying options.

    • Example: If a call option is trading at 120 and the lot size is 300, you must pay 120 × 300 = 36,000 in full; you cannot enter with a tiny margin.

    This reduces gambling‑style option buying, but for serious traders it creates a clean, defined‑risk structure where your maximum loss is clear from the start.

    2. Weekly Expiries, Lot Sizes and Expiry‑Day Margins

    The new framework also focuses on rationalising weekly expiries, adjusting lot sizes in some indices, and increasing margin requirements on expiry‑day, especially for option sellers.

    • On expiry‑day, extra margins such as an additional Extreme Loss Margin can apply, making naked short‑straddles and high‑leverage expiry games significantly riskier.

    From a trading perspective, expiry‑day aggressive option selling without strong risk control and capital buffer is no longer a smart move.

    Real Impact on Small Retail Traders

    1. Is High‑Leverage Scalping Now Much Harder?

    Traders who were relying on high leverage with small capital to build large intraday positions will feel the pain first.

    • To generate the same rupee profit, you now either need more capital or lower expectations.
    • Over‑trading, revenge trading and random stock picking will hurt faster, because the “safety cushion” of huge leverage has been removed.

    However, from a long‑term viewpoint, these rules protect traders who were trading purely on tips and emotions with no risk framework.

    2. How Should You Change Capital Management and Position Sizing?

    The game has shifted from “small capital + huge lot size” to “adequate capital + controlled lot size + fixed risk per trade”.

    • Ideally, you should not risk more than 1–2% of total capital on any single trade.
    • It is better to think in fixed rupee risk – for example, “I will not lose more than 1,000–2,000 per trade”, and then calculate quantity from that.

    This mindset helps you survive in the market for years, instead of blowing up the account in a few months.

    Practical Trading Tips – How to Trade After SEBI’s New Rules?

    1. Framework for Intraday Equity Traders

    • Take fewer but higher‑quality trades: Focus only on setups where trend, volume and levels are clear; avoid random 10–15 trades a day.
    • Pre‑define stop‑loss and targets: Mark your levels on the chart before entering and avoid emotional exits.
    • Stick to liquid largecaps and indices: In illiquid, low‑volume stocks, the earlier leverage advantage is gone; it is better to focus on Nifty 50 names and liquid midcaps.

    2. Option Strategies That Work Better With Higher Margins

    Naked option selling has become expensive and risky, but you can still use smarter, defined‑risk strategies:

    • Debit spreads (Bull Call or Bear Put): Limited loss, relatively lower capital; very suitable for beginners.
    • Defined‑risk credit spreads: Replace naked shorts with hedged spreads; your margin and risk both remain under control.
    • Positional swings instead of pure event gambling: Prefer 3–10 day swing setups over pure result‑day or news‑day lottery trades.

    Since you already work deeply with technicals and futures data, these strategies are natural extensions you can also showcase with real chart examples on your site.

    FAQs – Most Common Questions in 2026

    Q1: Is it now impossible to earn consistent income from intraday trading?
    No. It is not a high‑leverage game anymore; it is a skill + discipline game. You will need slightly more capital and much better risk control, but steady growth is still possible.

    Q2: Should small‑capital traders quit the market now?
    Not at all. They just need to reset expectations – smaller targets, slower compounding, and more focus on learning and process instead of quick profits.

    Q3: Is options trading now only for big‑capital traders?
    Big capital definitely has an edge, but small traders can still participate using defined‑risk spreads, smaller‑lot indices, and a learning‑first approach, while staying away from gambling‑style naked positions.

    Final Note

    SEBI’s new F&O and intraday margin rules for 2025–26 have made the market tougher but also clearer – the message is simple: survive long, don’t gamble short. Traders who take risk, capital and psychology seriously will be the ones still standing – and compounding – in the coming years.

  • Top 4 High-Probability Intraday Trading Setups for Indian Retail Traders in 2026

    Top 4 High-Probability Intraday Trading Setups for Indian Retail Traders in 2026

    High-probability intraday trading setups are rule-based patterns where price, volume, and market structure come together to offer a statistical edge over many trades. These setups do not guarantee profits; instead, they give you repeatable conditions where the odds tilt in your favour if you respect risk management.

    High-probability intraday trading setups India 2026 are especially useful for Indian retail traders trading Nifty, Bank Nifty, and liquid stocks because they reduce emotional, impulsive entries and force you to wait for clear confirmation.

    Market Context for Intraday Traders in 2026

    The Indian market in 2026 continues to show phases of strong trends followed by sharp corrections driven by macro events like the Union Budget, RBI policy decisions, and global data. Mid- and small-cap segments, along with SME IPOs, remain active, creating both opportunities and risk for intraday traders chasing momentum.

    With increased retail participation and algo activity, intraday moves have become faster, which makes having predefined setups and strict stop-losses absolutely essential.

    Setup 1: Opening Range Breakout (ORB) on Index Futures

    The Opening Range Breakout focuses on the price range formed during the first 15–30 minutes after market open in Nifty, Bank Nifty, or index futures. You mark the high and low of this opening range and take trades only when price breaks out with supporting volume and market breadth in the same direction.

    Basic rules:

    • Time window: 9:15–9:30 or 9:15–9:45 for defining the range
    • Buy above the opening range high with a stop-loss just below the range midpoint or low
    • Sell below the opening range low with a stop-loss just above the range midpoint or high
    • Avoid trades if there is a major event (Budget, RBI policy) scheduled within the same session

    Example: On a trending day after positive macro news, a strong gap-up followed by consolidation in the first 30 minutes can provide a clean upside ORB entry once the high is broken with rising volume.Setup 2: Pullback to 20 EMA in Strong Trend

    The 20-period Exponential Moving Average (EMA) is a popular dynamic support and resistance level on 5–15 minute charts. In a strong uptrend, price often pulls back to the 20 EMA before resuming the move, offering low-risk entries for intraday traders; in a strong downtrend, the 20 EMA acts as resistance.

    Basic rules:

    • Identify strong trend: Higher highs and higher lows for uptrend, lower highs and lower lows for downtrend
    • Enter near 20 EMA when a reversal candle (pin bar, bullish engulfing in uptrend; bearish in downtrend) forms with supportive volume
    • Place stop-loss slightly below the swing low (uptrend) or above the swing high (downtrend)
    • Target 1:1.5 or 1:2 risk–reward, or next intraday support/resistance

    This setup is powerful on trending days following major macro triggers such as RBI announcements or strong global cues, when the market respects moving averages well.

    Setup 2: Break of Previous Day High/Low with Volume

    Price breaking the previous day’s high or low attracts institutional activity, especially in index heavyweights and liquid F&O stocks. When this break happens with strong volume and broader market support, it can lead to a one-directional intraday move.

    Basic rules:

    • Mark previous day high (PDH) and previous day low (PDL) on your chart before the open
    • Go long only when price breaks and sustains above PDH with higher-than-average volume and positive index/sector trend
    • Go short only when price breaks and sustains below PDL with higher volume and weak index/sector trend
    • Avoid trades against the broader index direction or near major news events

    This setup works well when markets are trending over multiple days, often around result seasons or major macro data.Setup 4: VWAP Bounce and Rejection Strategy

    Volume Weighted Average Price (VWAP) represents the average price traded during the day adjusted for volume, and many institutional participants use it as a benchmark. When price approaches VWAP and reacts sharply, it can signal whether smart money is accumulating or distributing.

    Basic rules:

    • In an uptrend day, look for price to pull back to VWAP and show a bullish rejection candle with volume
    • In a downtrend day, look for price to retest VWAP from below and form a bearish rejection candle
    • Enter in the direction of the trend with stop-loss just beyond VWAP
    • Avoid trading when price chops around VWAP with no clear trend (sideways day)

    VWAP-based setups are very effective on days following strong news when institutions gradually build or unwind positions intraday.

    Setup 3: Intraday Breakout in SME/IPO Stocks (With Strict Risk Rules)

    The SME and IPO segment in India has seen high activity with several issues listing in 2025–2026, attracting retail traders for quick intraday gains. However, these stocks can be extremely volatile and illiquid, so a structured breakout approach with small position sizing is crucial.

    Basic rules:

    • Trade only highly liquid IPOs/SMEs with good listing volumes and clean intraday chart structure
    • Identify a clear consolidation or flag pattern after listing or early in the day and enter only on breakout with volume spike
    • Use strict stop-loss (for example 1–2 percent) and smaller capital allocation compared to index or large-cap trades
    • Avoid chasing vertical moves after multiple green candles; wait for consolidation

    This setup is best treated as an opportunistic add-on, not your primary bread-and-butter system, because gap risk and slippage can be high.Setup 6: News and Event-Based Trades (Budget, RBI Policy, Results)

    Macro events like the Union Budget, RBI Monetary Policy, inflation data, and corporate results often create short-term volatility spikes in indices and sectoral stocks. If handled with rules, event-based trades can offer strong intraday moves; if handled emotionally, they can also lead to rapid losses.

    Basic rules:

    • Avoid taking large positions just before the event announcement because spreads can widen and whipsaws are common
    • Wait for the first 5–15 minutes after the event to see the initial directional reaction
    • Enter only when price breaks a key intraday level (opening range, PDH/PDL, or VWAP) in line with the post-event direction
    • Reduce position size and accept that slippage can be higher than usual

    Examples: Union Budget days, RBI rate decisions, and major result announcements in banking, auto, or IT can provide strong intraday swings.

    Setup 4: Mean-Reversion in Range-Bound Markets

    Not every day is a trending day; many sessions remain range-bound with the index oscillating between support and resistance. On such days, mean-reversion setups—buying near support and selling near resistance with clear confirmation—can work better than breakout strategies.

    Basic rules:

    • Identify a clean intraday range where price has tested support and resistance multiple times
    • Buy near support only when a rejection candle or bullish pattern forms with stabilising volume; place stop-loss just below support
    • Sell near resistance only when a bearish rejection pattern forms with weakening volume or failed breakout
    • Do not try mean-reversion on strong trending days after big news; you will end up fighting momentum

    Mean-reversion setups are ideal for days when economic calendars are light and there are no major data releases lined up.Risk Management Rules for All Setups

    Regardless of how strong a setup looks, risk management is what keeps you in the game long enough for your edge to play out. Many new traders focus only on entries and ignore position sizing, maximum daily loss limits, and diversification across instruments.

    Core rules you can follow:

    • Risk per trade: 0.5–1 percent of capital for beginners
    • Maximum daily loss: Stop trading for the day after 2–3 losing trades or a total of about 2–3 percent drawdown
    • Use hard stop-loss orders instead of mental stop-losses, especially during event days
    • Maintain a trading journal with screenshots of setups, rationale, and post-trade review

    When you combine high-probability setups with disciplined risk management, even a modest win rate can yield consistent growth over time.

    Trading Psychology for Retail Intraday Traders

    Intraday trading psychology is often more important than the strategy itself because fear and greed can make you break your own rules. Overtrading, revenge trading after a loss, and FOMO during sharp moves are some of the most common behavioural traps Indian retail traders fall into.

    Simple psychological rules:

    • Commit to following only 1–3 setups at a time instead of chasing everything
    • Trade with predefined plans including entry, stop-loss, and target before you click buy or sell
    • Accept that missing a move is better than forcing a bad trade against your rules
    • Review your emotional state daily and reduce size or stop trading when you feel triggered or fatigued

    Working on psychology is continuous, but it can be the one change that turns a breakeven trader into a consistently profitable one.How to Practically Implement These Setups with a Trading Journal

    To make these intraday trading setups India 2026 truly work for you, you must test them on your own charts, instruments, and timeframes. Start with paper trading or small capital and record at least 30–50 trades per setup before deciding whether it suits your style.

    Suggested implementation steps:

    • Pick 2–3 setups (for example ORB, 20 EMA pullback, VWAP bounce) and focus only on them for one to three months
    • Use a structured journal (spreadsheet or notebook) to record date, instrument, setup type, entry, stop, target, result, and notes
    • Review weekly to see which setups work best for you in current market conditions and which ones need adjustments or should be dropped
    • Gradually scale position size only when you see stability in execution and risk control, not just when you have a lucky winning streak

    By combining high-probability intraday trading setups India 2026, strict risk management, and honest journaling, Indian retail traders can build a professional approach aligned with the educational vision of Learn Share Market.

    Disclaimer: Trading in derivatives involves high risk. This post is for educational purposes only. Always consult a SEBI-registered advisor before making investment decisions.

  • Best Intraday Trading Strategies for Indian Retail Traders in 2025 (With Practical Examples)

    Intraday trading in India has exploded in 2024-2025, with retail participation at an all-time high. The stock market volatility, lower brokerage costs, and accessibility of trading platforms have made day trading more attractive than ever. However, without proven strategies and disciplined execution, most traders lose money. This guide covers the best intraday trading strategies specifically designed for Indian retail traders, complete with practical examples and risk management rules.

    Why Intraday Trading is Booming in 2025

    The Indian intraday trading market has grown significantly due to several factors:

    • Increased Retail Participation: More Indians now trade actively through mobile apps and funded accounts.
    • Lower Brokerage Costs: Flat fees and zero-brokerage models have reduced transaction costs dramatically.
    • Market Volatility: Economic changes, geopolitical events, and FII activity create daily price movements, presenting day trading opportunities.
    • Better Technology: Real-time charting tools, scanners, and AI-powered alerts have made analysis more accessible.

    However, this growth comes with a warning: Over 90% of retail day traders lose money. The difference between winners and losers is not luck—it’s a proven strategy, disciplined execution, and strict risk management.

    What Makes a Winning Intraday Strategy?

    Before diving into specific strategies, let’s understand the characteristics of a high-probability intraday strategy:

    1. Liquidity: Trade only highly liquid instruments—large-cap stocks, index futures (Nifty, Bank Nifty), and ETFs.
    2. Clear Entry and Exit Rules: Ambiguity leads to emotional trading and losses.
    3. Tight Risk-Reward Ratio: Aim for at least 1:2 risk-reward on every trade (risk 1% to make 2%).
    4. Backtested and Paper Traded: Never trade live without proving the strategy works first.
    5. Position Sizing: Never risk more than 1-2% of your capital per trade.

    Best Intraday Trading Indicators for Indian Markets

    These indicators work best on 5-minute, 15-minute, and 1-hour charts:

    1. Volume Weighted Average Price (VWAP)

    VWAP shows the average price at which institutional investors are trading. Intraday reversals often happen at VWAP levels. On high-volume breakouts, price respecting VWAP is a strong bullish or bearish signal.

    2. Exponential Moving Averages (EMA)

    Use 9-period and 20-period EMAs on 5-minute charts. When the 9 EMA is above the 20 EMA, the trend is up. Pullbacks to the 9 EMA are ideal buy zones in an uptrend.

    3. Relative Strength Index (RSI)

    RSI above 70 indicates overbought conditions, and below 30 indicates oversold conditions. However, in strong intraday trends, RSI can remain overbought or oversold for extended periods. Use RSI for divergence trading rather than absolute levels.

    4. Volume

    Volume confirms breakouts. A price breakout on low volume is likely to fail. True breakouts always come with increased volume.

    Strategy 1: Opening Range Breakout (ORB) for Nifty and Bank Nifty

    The Opening Range Breakout strategy is one of the most popular intraday trading strategies in India, especially for index futures.

    How It Works:

    1. Time Frame: First 15-30 minutes of market open (9:15 AM to 9:45 AM IST).
    2. Mark the Range: Note the high and low of the first 15-30 minutes.
    3. Calculate Mid-Point: (High + Low) / 2
    4. Entry Rules:
    • Long Entry: When price breaks above the range high with confirmed volume. Stop loss: 10-15 pips below the mid-point.
    • Short Entry: When price breaks below the range low. Stop loss: 10-15 pips above the mid-point.
    1. Profit Target: 1.5 to 2.5 times the risk taken (e.g., if you risk 15 pips, target 30-40 pips).

    Example:

    Suppose Bank Nifty opens with the following range in the first 30 minutes:

    • High: 52,200
    • Low: 52,000
    • Mid-point: 52,100

    Long Setup: If Bank Nifty breaks above 52,200 on volume, enter at 52,220. Stop loss at 52,085 (risk: 135 points). Target: 52,350 (reward: 130 points). Risk-reward is approximately 1:0.96 (not ideal but acceptable if the strategy hits 60%+ winning trades).

    Short Setup: If Bank Nifty breaks below 52,000 on volume, enter at 51,980. Stop loss at 52,115 (risk: 135 points). Target: 51,850 (reward: 130 points).

    Key Points:

    • This strategy works best on volatile days.
    • On range-bound days, multiple false breakouts can lead to losses.
    • Avoid trading if major economic news (RBI policy, US Fed announcement) is expected within 1-2 hours.

    Strategy 2: VWAP Pullback Strategy for Liquid Large-Caps

    This strategy works well on highly liquid stocks like SBI, HDFC Bank, TCS, Infosys, and Reliance, which have high intraday volume and minimal spreads.

    How It Works:

    1. Identify the Trend: Check the 15-minute or 1-hour chart. Is the stock moving in an uptrend or downtrend?
    2. Find VWAP: Plot VWAP on your 5-minute chart.
    3. Wait for a Pullback: After a strong intraday move, wait for price to pullback near VWAP with volume drying up.
    4. Entry: When price approaches VWAP from above (in an uptrend), enter on reversal candles (Doji, Hammer) on high volume. Stop loss: 2-3% below VWAP.
    5. Profit Target: Exit at 1:1 risk-reward or trail the stop using the 9 EMA.

    Example:

    Suppose TCS is in an intraday uptrend on the 15-minute chart:

    • Trend high: 3,520
    • Pullback to VWAP: 3,480
    • Current price: 3,485

    Entry: Buy at 3,490 (on reversal candle confirmation). Stop loss: 3,460 (risk: 30 points). Target: 3,520 (reward: 30 points).

    Key Points:

    • This strategy has a high win rate (60-70%) because it trades in the direction of the trend.
    • It works best when the trend is clean and strong.
    • On choppy, sideways days, pullbacks can be fake, leading to losses.

    Strategy 3: Breakout + Retest Strategy on 5-Minute Charts

    This strategy takes advantage of the fact that traders often chase breakouts, and the initial move is usually too fast. The retest offers a better risk-reward entry.

    How It Works:

    1. Identify Key Levels: Mark intraday support and resistance on 5-minute or 15-minute charts.
    2. Wait for Breakout: Wait for price to break above resistance or below support on high volume.
    3. First Pullback: Instead of entering at the breakout, wait for price to retest the broken level (now acting as support for upside breakouts).
    4. Entry on Retest: Enter when price reverses from the retest on volume. Stop loss: Just below the retest low (for long breakout).
    5. Target: 1.5-2x the risk taken.

    Example:

    Suppose Infosys on a 5-minute chart has:

    • Resistance at 1,950
    • Price breaks above 1,950 to 1,965 on high volume
    • Price then retests 1,950 to 1,955 with lower volume

    Entry: Buy at 1,957 (on reversal from retest). Stop loss: 1,945 (risk: 12 points). Target: 1,975 (reward: 18 points). Risk-reward: 1:1.5, which is acceptable.

    Key Points:

    • This strategy has a higher win rate than chasing breakouts.
    • It reduces false breakout risks.
    • It works best on volatile, high-volume trading days.

    Risk Management Rules for Indian Intraday Traders

    No strategy works if risk is not managed properly. Follow these rules strictly:

    1. Fixed Daily Loss Limit

    Set a maximum daily loss of 2-3% of your trading capital. Once you hit this limit, stop trading for the day. If you start with ₹1,00,000, your max daily loss should be ₹2,000 to ₹3,000.

    2. Position Sizing

    Risk only 1-2% per trade. If a trade requires a 30-point stop loss and each point is worth ₹100 in Bank Nifty, the risk is ₹3,000. With ₹1,00,000 capital, this is 3% risk—too high. Reduce the position size.

    3. Always Use Stop Losses

    Never trade without a predetermined stop loss. Averaging down in intraday trading is extremely dangerous because intraday moves can be severe.

    4. Margin Management

    Be cautious with leverage. Just because your broker allows you to trade with 5x margin doesn’t mean you should. Over-leverage amplifies losses quickly.

    5. Maximum Trades Per Day

    Limit yourself to 5-8 trades per day. Over-trading leads to emotional decisions and losses.

    6. Avoid News Events

    Don’t trade in the 30 minutes before or after major news events (RBI policy, US Fed decisions, election results, corporate earnings). These events cause extreme volatility and gap moves that stop losses can’t protect against.

    Common Intraday Trading Mistakes to Avoid

    1. Revenge Trading

    After a loss, many traders take bigger risks to recover losses quickly. This leads to larger losses. Stick to your position sizing.

    2. Trading Illiquid Stocks

    Small-cap stocks and penny stocks have wide bid-ask spreads. You’ll lose money to spread costs alone before the trade works.

    3. No Trading Plan

    Entering trades based on “feeling” or tips leads to emotional trading and losses. Every trade must have a planned entry, exit, and stop loss.

    4. Ignoring Trend Direction

    Trading against the primary trend is counterintuitive. If Nifty is down 200 points, avoid buying individual stocks on weakness unless there’s a specific technical setup.

    5. Switching Strategies

    Traders often abandon a strategy after 2-3 losses and switch to something else. Strategies need 50+ trades to prove themselves. Give each strategy at least a month of trading.

    6. Trading During Low Volume Hours

    Intraday volume is highest from 9:15 AM to 11 AM IST and lowest from 12:30 PM to 2:30 PM. Trade during high-volume periods for better execution.

    How to Practice and Master These Strategies

    Step 1: Backtest

    Before trading live, backtest each strategy on 50-100 historical trades using free tools like TradingView or Zerodha’s backtest feature. Track the win rate, average win, and average loss.

    Step 2: Paper Trade

    Once backtesting shows a positive expectancy (average win × win rate > average loss × loss rate), paper trade for 1-2 weeks. Execute the exact same way you would with real money.

    Step 3: Live Trading (Small Size)

    Start with the smallest position size possible. Trade live for 2-4 weeks with real money but minimal capital at risk. This builds experience and psychological resilience.

    Step 4: Scale Up Gradually

    Once you’re consistently profitable on small size, gradually increase position size. Never double your position size after a winning week.

    Final Thoughts: The Key to Intraday Success

    The best intraday trading strategies for Indian retail traders share common traits: they’re simple, they’re based on price action and volume, and they prioritize risk management over big profits. Trading is a long-term game. Strategies that have a 55-60% win rate and a 1:1.5 risk-reward ratio will make you money over time if you follow them consistently.

    Remember: The goal is not to find the “perfect” strategy—it’s to find a strategy that works for you and execute it with discipline. Start small, backtest thoroughly, and scale gradually. Most importantly, respect your stop losses and never risk more than you can afford to lose.

    Start your intraday trading journey today with proven strategies and proper risk management. The Indian stock market is full of opportunities for disciplined traders who follow a systematic approach.

    Disclaimer: This article is for educational purposes only and does not constitute financial advice. Always consult with a SEBI-registered investment advisor before trading. Past performance does not guarantee future results. Intraday trading carries significant risk of capital loss.