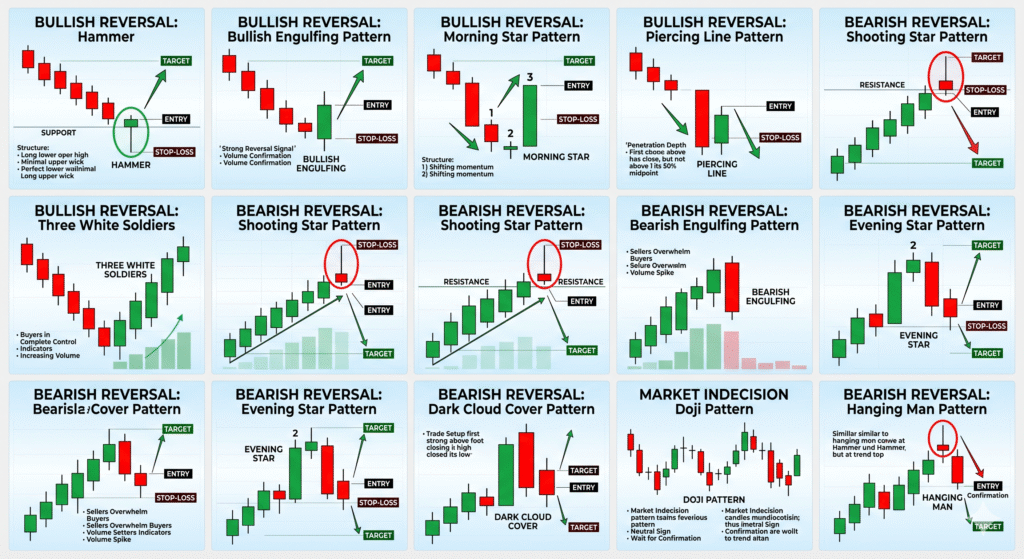
candlestick patterns India 2026 are the foundation of technical analysis and one of the most powerful tools any trader can master. Whether you are trading Bank Nifty options, Nifty 50 futures, or individual stocks, understanding these patterns gives you a significant edge in reading market sentiment and timing your entries and exits. In this comprehensive guide, we will explore 11 powerful candlestick patterns that every Indian trader should know in 2026, complete with practical examples that you can apply to your trading right away.
What is a Candlestick Chart?
A candlestick chart is a type of financial chart used to describe price movements of a security, derivative, or currency. Each candlestick represents a specific time period and shows four key pieces of information: the opening price, closing price, high price, and low price. A green or white candle indicates a bullish period where the closing price is higher than the opening price. A red or black candle indicates a bearish period where the closing price is lower than the opening price. The thin lines extending from the top and bottom are called wicks or shadows, representing the price extremes during that period.
Why Candlestick Patterns Matter
Candlestick patterns reveal the psychology of market participants. Each pattern tells a story about the battle between buyers (bulls) and sellers (bears). When you learn to read these patterns, you are essentially reading market sentiment before it plays out. This gives you a significant advantage over traders who rely solely on lagging indicators. The patterns we discuss below are among the most reliable and widely used by professional traders across the world.
BULLISH REVERSAL PATTERNS
Hammer
Structure: A single candle with a small body at the top and a long lower wick (at least twice the size of the body). The upper wick is minimal or non-existent.
What It Signals: The Hammer appears after a downtrend and signals a potential bullish reversal. It shows that sellers pushed prices down significantly during the session, but buyers stepped in strongly and drove the price back up near the opening level, indicating buying pressure is increasing.
How to Trade It: Look for the Hammer pattern near a key support level after a clear downtrend.
Entry: Place a buy order above the high of the Hammer candle.
Stop-Loss: Place the stop-loss just below the low of the Hammer candle.
Target: Aim for the next resistance level.
Example: If Tata Motors is in a downtrend and forms a Hammer at Rs. 900, with a low of Rs. 880 and a high of Rs. 910, you can enter above Rs. 910, set a stop-loss below Rs. 880, and target the next resistance at Rs. 950.
Bullish Engulfing Pattern
Structure: A two-candle pattern where a large green (bullish) candle completely engulfs the body of the preceding small red (bearish) candle. The pattern forms at the bottom of a downtrend.
What It Signals: The Bullish Engulfing is one of the strongest reversal signals. It indicates that buyers have aggressively stepped in and overwhelmed the selling pressure, suggesting a potential trend reversal from bearish to bullish.
How to Trade It: Look for this pattern near support levels or after a sustained downtrend on Bank Nifty, Nifty 50, or individual stocks.
Confirmation: Always look for high volume on the green engulfing candle for added reliability.
Entry: Buy above the high of the engulfing candle.
Stop-Loss: Place below the low of the red candle.
Morning Star Pattern
Structure: A three-candle pattern consisting of a long bearish candle, followed by a small-bodied candle (either bullish or bearish), and ending with a long bullish candle.
What It Signals: The Morning Star signals a strong bullish reversal. It shows that sellers are losing control, buyers are stepping in, and the momentum is shifting upward. The longer the third bullish candle, the more reliable the reversal signal.
How to Trade It: This pattern is highly reliable when it appears after a sustained downtrend. Look for volume confirmation on the third candle.
Entry: Buy above the high of the third candle.
Stop-Loss: Below the low of the Morning Star formation.
Target: Next major resistance level or previous swing high.
Example: When Reliance Industries fell from Rs. 2,800 and formed a Morning Star at Rs. 2,400, buyers could enter at Rs. 2,420 with a stop-loss at Rs. 2,380 and target Rs. 2,600.
Piercing Line Pattern
Structure: A two-candle pattern where a strong bearish candle is followed by a bullish candle that opens below the previous candle’s close but closes above the midpoint (50%) of the first bearish candle.
What It Signals: The Piercing Line indicates a bullish reversal signal, showing that buyers are stepping in and reversing the downtrend. The more the second candle penetrates into the first candle, the stronger the reversal signal.
How to Trade It: Look for this pattern at support zones on daily or 15-minute charts for intraday trades.
Entry: Buy above the high of the piercing candle.
Stop-Loss: Below the low of the Piercing Line formation.
Three White Soldiers
Structure: Three consecutive long bullish candles, each opening within the body of the previous candle and closing at a new high. All three candles should have minimal upper wicks.
What It Signals: Three White Soldiers is a very strong bullish reversal pattern. It shows that buyers are in complete control and are pushing prices higher with conviction across multiple sessions.
How to Trade It: This pattern is most reliable after a prolonged downtrend. Look for increasing volume across all three candles for added confirmation.
Entry: Enter after the third candle closes, on the next candle’s open.
Stop-Loss: Below the low of the first soldier candle.
BEARISH REVERSAL PATTERNS
Shooting Star Pattern
Structure: A single candlestick with a small body at the bottom and a long upper wick. The lower wick is minimal or non-existent. The Shooting Star is the bearish opposite of the Hammer.
What It Signals: The Shooting Star appears after an uptrend and signals a potential bearish reversal. It shows that buyers pushed the price higher during the session, but sellers aggressively rejected the highs and pushed the price back down, indicating selling pressure is building.
How to Trade It: Look for this pattern near resistance levels after a clear uptrend on Bank Nifty or Nifty options.
Entry: Place a sell (short) order below the low of the Shooting Star candle.
Stop-Loss: Above the high of the Shooting Star candle.
Target: The next support level below.
Example: If Bank Nifty is trending up and forms a Shooting Star at 52,000 with a high of 52,200 and low of 51,800, traders can short below 51,800 with a stop-loss above 52,200, targeting 51,400.
Bearish Engulfing Pattern
Structure: A two-candle pattern where a large red (bearish) candle completely engulfs the body of the preceding small green (bullish) candle. This is the bearish counterpart of the Bullish Engulfing.
What It Signals: The Bearish Engulfing implies that sellers have overwhelmed the buyers, suggesting a shift in market sentiment from bullish to bearish. It is one of the strongest bearish reversal signals.
How to Trade It: Look for this pattern near resistance zones. Always confirm with high volume on the red engulfing candle.
Entry: Sell below the low of the engulfing candle.
Stop-Loss: Above the high of the engulfing candle.
Evening Star Pattern
Structure: A three-candle pattern consisting of a long bullish candle, followed by a small-bodied candle, and then a long bearish candle. It is the bearish opposite of the Morning Star.
What It Signals: The Evening Star indicates the reversal of an uptrend. The pattern is particularly strong when the third candle completely erases the gains of the first candle, showing that sellers have taken full control.
How to Trade It: Highly reliable when it appears after a strong uptrend. Watch for volume spike on the third candle.
Entry: Sell below the low of the third candle.
Stop-Loss: Above the high of the Evening Star formation.
Dark Cloud Cover Pattern
Structure: A two-candle pattern where a long green candle is followed by a long red candle that opens above the previous green candle’s high and closes below its low.
What It Signals: This pattern signals a potential reversal of the uptrend. It shows that despite the bullish momentum on the first day, sellers took complete control on the second day, pushing the price below the previous low.
How to Trade It: Look for this pattern at resistance zones on daily charts for swing trades, or on 15-minute charts for intraday setups.
Entry: Sell below the low of the Dark Cloud Cover formation.
Stop-Loss: Above the high of the red candle.
Doji Pattern (Market Indecision)
Structure: A Doji forms when the opening and closing prices are almost identical, creating a candle with no body or a very small body and equal upper and lower shadows. It looks like a cross or plus sign.
What It Signals: The Doji signifies indecision in the market. Neither bulls nor bears are in control, and a potential reversal or significant price move could be imminent. A Doji appearing after a strong trend often signals trend exhaustion.
How to Trade It: Never trade a Doji in isolation. Always wait for confirmation from the next candle.
If the next candle is bullish, consider a long entry. If bearish, consider a short entry.
Hanging Man Pattern
Structure: A single candlestick with a small body at the top and a long lower wick, similar to the Hammer but appearing at the top of an uptrend instead of the bottom of a downtrend.
What It Signals: The Hanging Man indicates that buyers are losing control and sellers may be taking charge. Although the price was pushed up during the session, sellers managed to drive it down significantly, warning of a possible bearish reversal.
How to Trade It: Look for this pattern near resistance levels after a sustained uptrend. Wait for bearish confirmation from the next candle before entering a short position.
Entry: Sell below the low of the Hanging Man candle after bearish confirmation.
Stop-Loss: Above the high of the Hanging Man candle.
Key Tips for Trading Candlestick Patterns Successfully
Here are essential tips every Indian trader should follow when using candlestick patterns:
Always trade patterns at key support or resistance levels for higher probability setups.
Confirm patterns with volume. High volume during the pattern formation increases reliability.
Combine candlestick patterns with other technical tools like moving averages, RSI, or MACD for confluence.
Always use a stop-loss. No pattern is 100% reliable.
Practice pattern recognition on historical charts before risking real money.
Patterns work across all timeframes, but daily and 15-minute charts are most popular among Indian traders for swing and intraday trading respectively.
Conclusion
Mastering candlestick patterns is a game-changer for any trader looking to succeed in the Indian stock market. These 11 powerful candlestick patterns provide a visual representation of market psychology and can significantly improve your entry and exit timing. Whether you trade Bank Nifty options, Nifty 50 futures, or individual stocks on NSE and BSE, these patterns will serve as your roadmap to understanding price action.
Remember, no single pattern guarantees success. The key is to combine these patterns with proper risk management, sound trading psychology, and confirmation from other technical tools. Start by mastering 3-4 patterns, practice them consistently on paper trades or with small positions, and gradually expand your knowledge. With dedication and practice, candlestick patterns will become an invaluable part of your trading toolkit.